A simple explainer for beginners in the Knowledge Graph and Semantic Metadata playing field…
What is Knowledge Graph Technology?
Explained traditionally, the concept refers to a knowledge base that uses graph-structured data model topologies to integrate entities, while encoding the semantics underlying the used data.
So, what does that mean?
Simply put, Knowledge Graph Technology connects data in a ‘behind the scenes’ way, uncovering links which a user didn’t know existed, and consequently don’t release the value of.
Therefore, graph technology may interlink data through previously unapparent relationships.
- Revealing connections
- Uncovering knowledge
In this representation, the circle size is scaled to represent number of uses- circles with larger areas have been used more often for data management or analytics. We can use this Knowledge Graph to highlight unused and disconnected datasets.
Why is this important?
Finding new links between data can allow it to be viewed in a new light, with added context via semantic metadata.
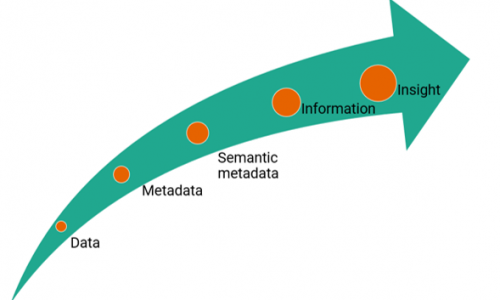
1) Data = raw facts and figures
An example of data for a rainforest may include a collection of facts such as tree count, area size, rainfall, and species count.
2) Metadata = data about data
This tends to remain the same regardless of context: source, date collected, size of file, date last used, and in Slingshot’s case what the data can links to.
3) Semantic metadata = added references, meaning and context
Taking the data of ‘rainforest rainfall’ as a specific example, ‘rainfall’ can be tagged as ‘weather’ and then linked semantically to a dataset containing information about other recognised ‘weather’ encompassed datasets such as ‘sunshine’.
Through contextualisation, this leads to larger realisations of the connections between related semantic metadata.

4) Information = data which has been processed
After the semantic metadata has been collated into relationships, we may uncover the information the combination of rainfall and sunshine which leads to optimal tree growth.
5) Insight = discoveries made through information
Because of the interlinked and uncovered layers of information, we can discover ultimate insights. For example, having the best environmental impact by efficiently identifying optimal weather areas in which to plant trees.

What can we show?
Take a peek at our platform visualisation…
Correlated interlinked semantic metadata is presented through an interactive model.
Dots represent datasets (with a circle area which can be personalised to depend on either dataset file size, times used, number of records, etc.) and lines demonstrating the links between them, geospatial or value recognition. Circle area and colour can also be tailored for further visualisation.
