The Challenge
The World Health Organisation discovered that 3 million deaths a year are caused by air pollution and is recognised as a contributing factor in the onset of Heart Disease and Cancer. With city councils declaring climate emergencies it became evident that a rapid response was needed.
Back in March we embarked on a project with the Open Data Institute (ODI) and Lloyd’s Register Foundation entitled the “Breathing City” project with one clear mission: To demonstrate how open data can be used to create a digital representation of a city, which could provide valuable insights about the impact of pollution and help decision makers to improve the wellbeing and safety of city populations.
How did we go about it?
1. Analysing
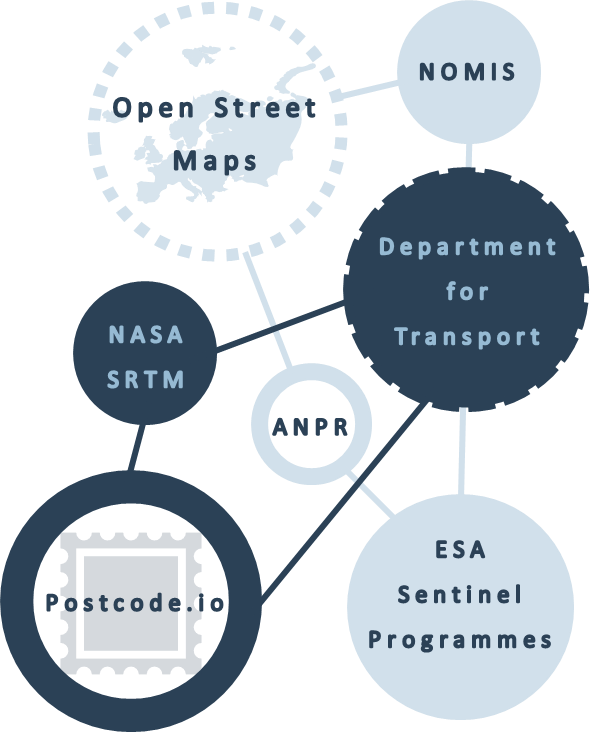
We started by surveying the following open data sources:
- Open Street Maps
- NASA SRTM
- ESA Sentinel Programmes
- ANPR (with pollution data)
- Department for Transport Datasets
- Postcode.io
- NOMIS
From this, we could identify the common reference points between each source and discover any gaps or missing data.
2. Integrating
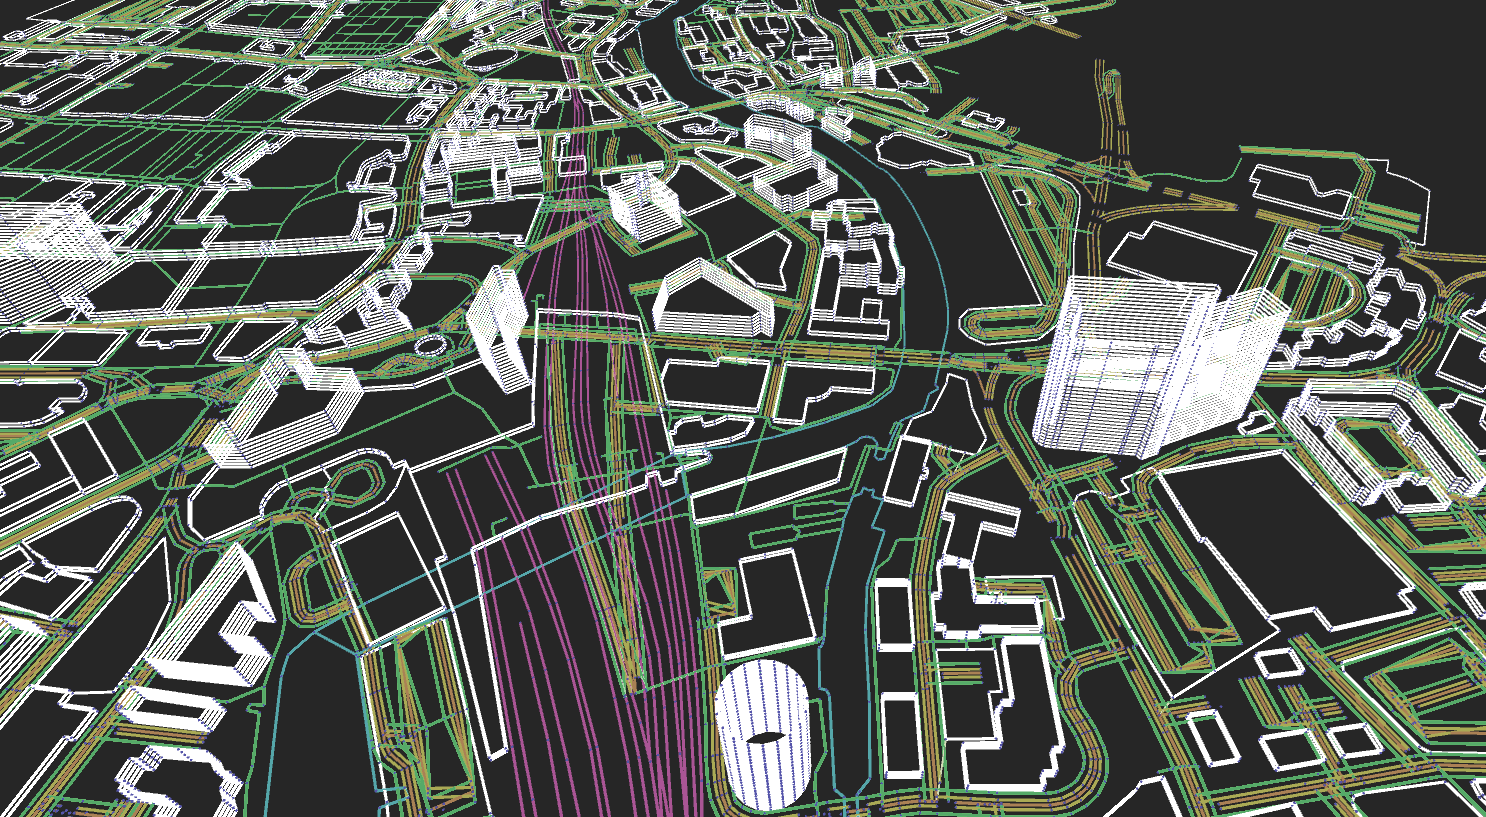
Once we had analysed the data, we collated those sources into an integrated reference data architecture as depicted visually below where each shape, line, or colour relates to a datapoint or dataset:
3. Visualising
From there we could start to build the Digital Twin. This started by using the satellite data for its terrain and topology information that generated the base of the 3D visual map.
This part was especially important as a Digital Twin thrives on contextual sources: It pins data to a particular place and creates a canvas upon which you can present and tell the story of the other data sets and how they fit in with other parts of the city.
Example
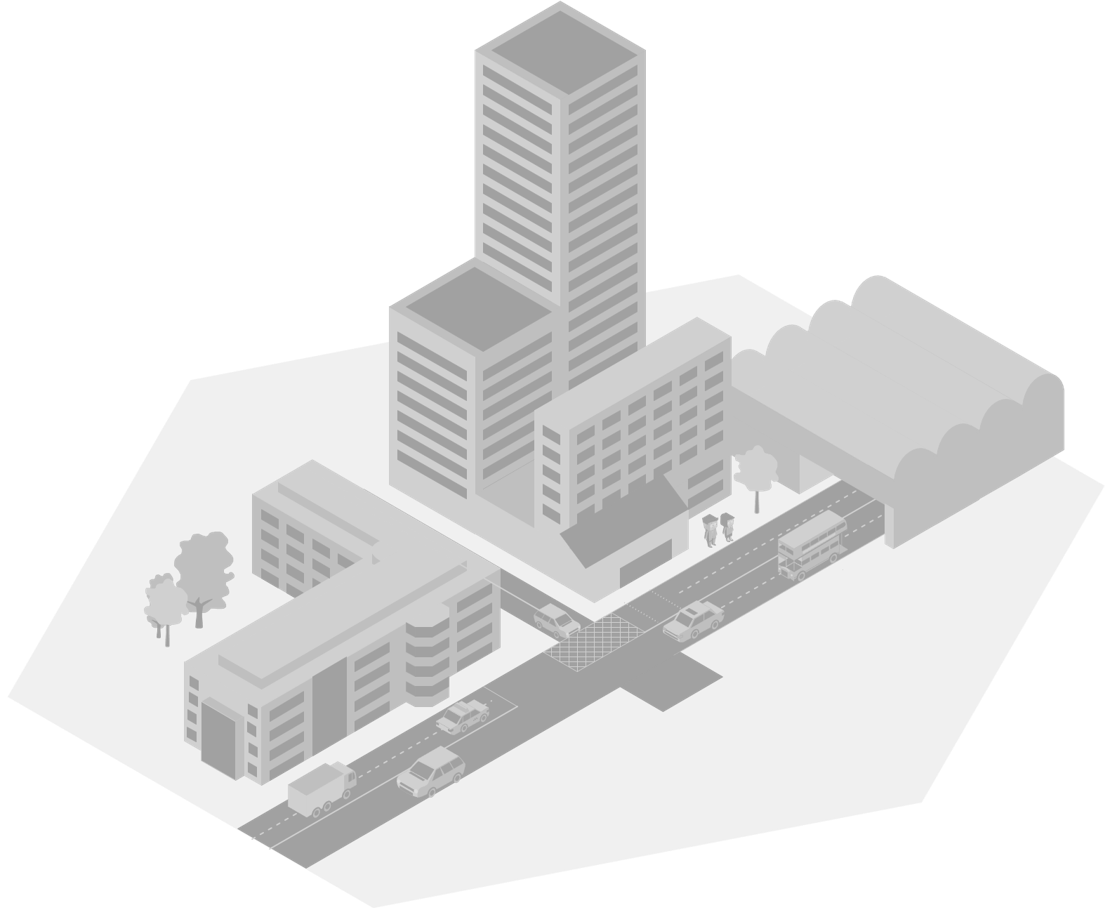
Neville Street in Leeds is one of the most polluted streets in the UK. If you want to see how pollution affects pedestrians on Neville street at certain times of day, our 3D world combines and layers its open data sources so you can see traffic jams on that street with its corresponding pollution statistics and the number of pedestrians on the pavement who would be affected by that pollution.
4. Decision-Making
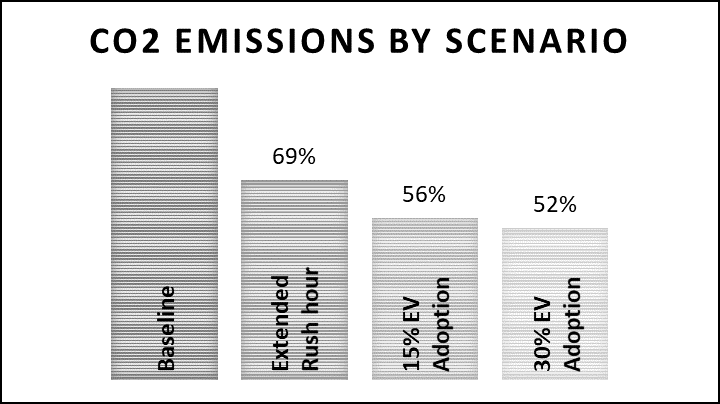
The final part was showing the ODI and Leeds’s local authority how to use this 3D virtual environment of Leeds. By putting this Digital Twin of the city into the hands of the decision makers, they could quickly make changes in the simulated environment to see the outcomes without affecting the wellbeing of individuals. For example, they can close a road, see the impact of spreading out rush hour, or greater electric vehicle adoption without having to spend the time or money testing this in the real world.
Results
Storytelling
As a result of our digital representation of Leeds city, we can showcase the impacts of pollution on city populations through a visual narration of a wide range of virtual scenarios. This virtual storytelling provides new means of educating the public on the impacts of pollution whilst allowing key decision makers to deliver informed choices to their city.
Stakeholders can run multiple scenarios in seconds observing the often-significant impact of subtle changes.
Successful integration of Open Data
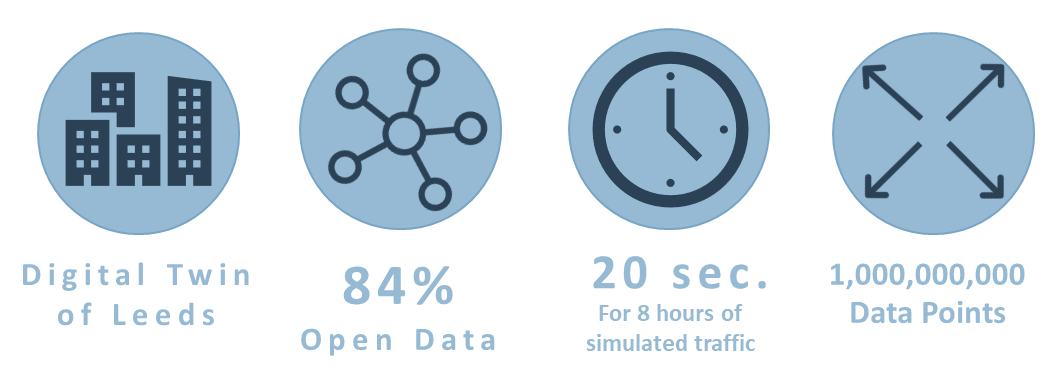
84% of our data sources were Open Data when creating the Digital Twin of Leeds city. This creates a baseline reference for future projects, which reduces future costs for clients.
Scale
“The model generates a 3D model from open datasets in a roughly 1 mile radius. They [Slingshot Simulations] have also been able to run this at up to a 30 mile radius, equivalent to 2,500 square km” ODI
Throughout this project we generated roughly 200GB of data in total, and over a billion datapoints.
This enormous scale is demonstrating the ability of the Slingshot platform to create Digital Twins at a city, or possibly at a national, scale. Whilst achieving that massive scale, you are still able to easily move between macro and micro levels of detail. We can provide insights at a level that is useful for stakeholders.
Speed
“The simulations for Leeds generate roughly 10GB per second of data and take roughly 20s to run a simulation equivalent to eight hours of traffic, modelling every 5s of agent behaviour.” ODI
By running at that speed, we are able to provide timely (faster than real-time) insights, without having to waits hours or days for a hugely complex simulation to run.
These insights are reached within just a few clicks on an interactive 3D map allowing models to be configured in under 20 minutes, rather than several weeks, and results delivered whilst a coffee is brewed.
So what?
We can test real-world solutions virtually
By combining multiple data sources into one 3D virtual environment that can be simulated and changed repeatedly, the project has demonstrated that decisions can be tried, tested and assessed quickly and accurately in the virtual world, avoiding actively affecting the safety of individuals.
Subtle changes can make a huge impact
By using a 3D world as a canvas and including as many data sources as possible, we have shown that its not just large data sources that contribute to the digital environment– even the smallest data sources can make subtle changes that result huge impacts on the world around us.
Pollution impact can be understood by scaling-up
The Breathing City project identified that scale has been a limitation of previous approaches to Digital Twins. To reliably understand the impacts on Leeds city citizens, we need to understand the flow of traffic in Leeds city centre, to understand that, we need to know where it is coming from which means extending the model further out to as far as M1 and M62 junctions or further.
“The insights generated should inform and support Leeds City Council to meet their targets to reduce the effects of air pollution” ODI
This contextual expansion is an ongoing piece of work with Leeds City Council which will result in one of the biggest Digital twins ever built.
This solution can be deployed Anywhere
“Slingshot has provided the basis for similar models to scale up in different locations.” ODI
As a result of this project we have had a number of other city councils who are interested in adjusting the model for their cities, such as Newcastle-under-Lyme.
You can read the ODI’s blog post here: https://theodi.org/article/case-study-creating-a-digital-version-of-a-city/
